Did clothing sales cool down despite the summer sales period?
The summer sales period provided a boost in activity not seen since January, but performance may have been affected by eager shoppers jumping to spend immediately after a difficult lockdown.
Given the warm weather and discounted prices on offer, the July sales period presented the ready to wear fashion industry the first opportunity since January and the end of the painful lockdown to drive sales and clear inventory to make way for new collections. Did this entice French consumers to make their way to the racks and fill-up their digital carts, or did the summer sales period fall flat upon taking the runway?
Looking back to January
Given the constraints of the global pandemic still restricting travel from many countries and many able travelers in the EU putting their plans on hold, the July sales period was always going to see a fall in consumption, especially in tourist-heavy city centers. However, our barometer, which looks exclusively at French cardholders' consumption, also showed a slowdown in sales participation compared to the winter sales in January.
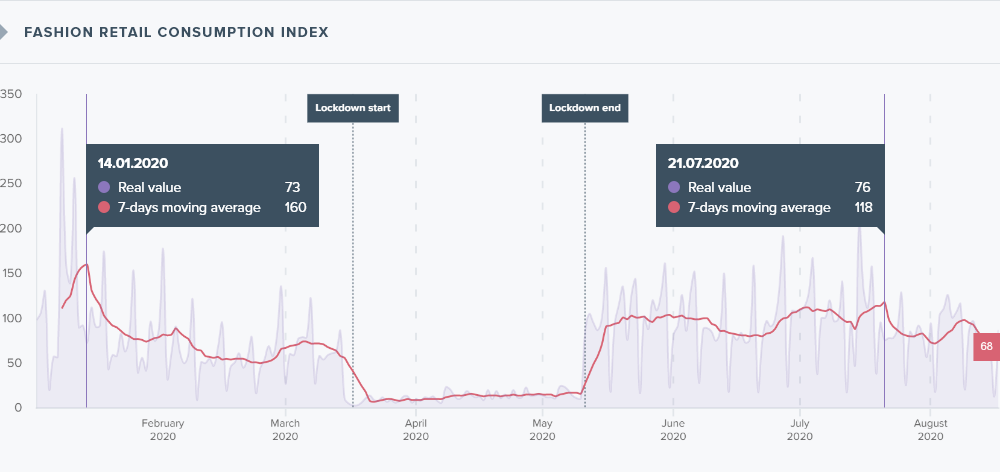
While the first week of sales saw an anticipated rise in the seven day moving average of consumption that reached 117 percent, the jump paled in comparison to the peak observed during the January sales period, which climbed to 160 percent. These indexes are based upon the average consumption seen in the first two months of 2020.
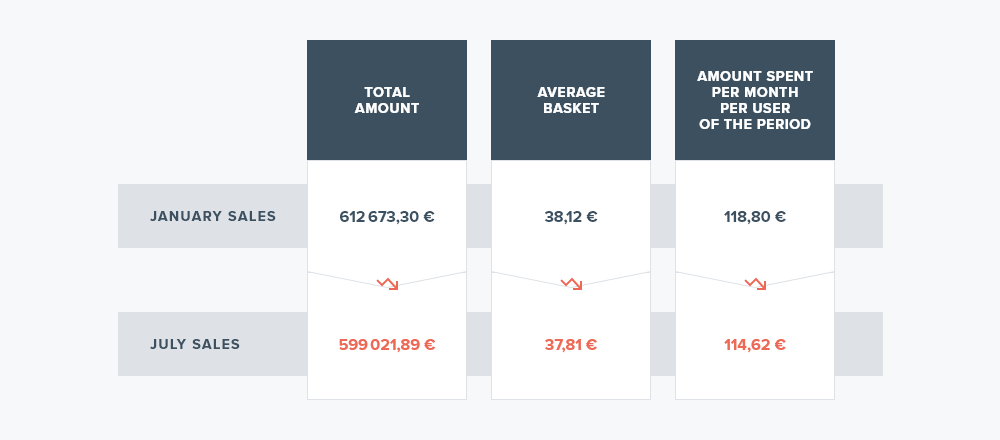
Key metrics such as total amount spent, average basket, and amount spent per user during the sales period also saw a slight fall, but a fall nonetheless that characterized a slow down for retailers looking to move inventory following a tough period.
One trend of note that seems to hold true when looking at 2020's winter and summer sales is the heightened frequency of purchases accompanied by a slight decrease in basket size. In the pre-lockdown period following the January sales and the post lockdown period preceding the July sales the average monthly frequency of purchases falls; however, the average basket size rises, as seen in figures five and six below.
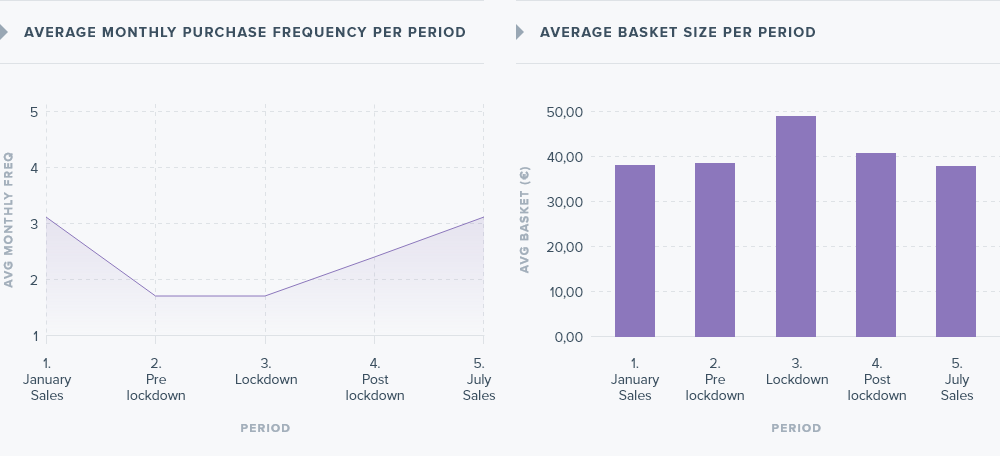
The increased frequency during both sale periods is quite surely due to shoppers looking to find deals in various stores, while the fall in basket size is due to the discounted items purchased during the sale period. Inversely, the decrease in frequency and rise in basket size witnessed before and after the sales may be explained by shoppers paying full price for items and having less reason to venture into stores without sales to pull them in.
Eager post confinement shoppers
Quite possibly, the most interesting take away from the analysis of fashion consumption was the increase observed in the post lockdown period. During the two months following confinement, monthly spending per user was considerably higher (82€) than the pre-lockdown period following sales (74€). The purchase frequency also increased following the lockdown coming in at 2.02 times per month versus the 1.9 times per month registered pre lockdown.
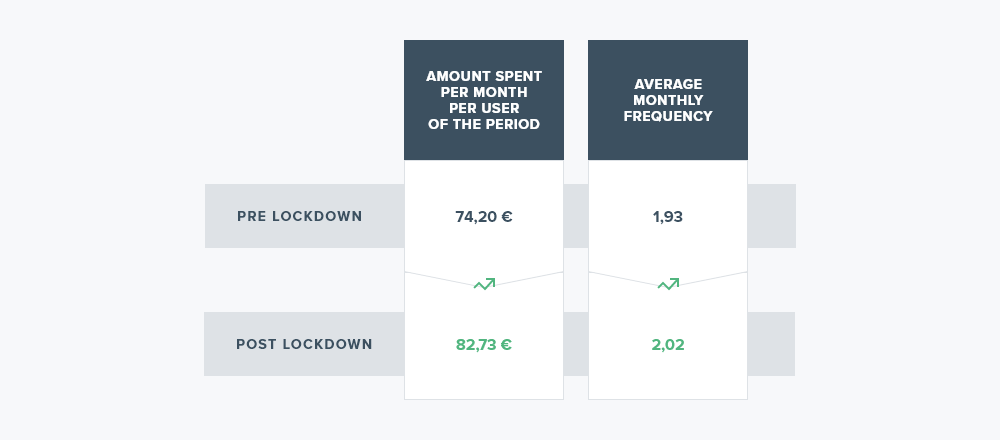
This may have been a celebration for stir-crazy shoppers finally enjoying a bit of retail therapy following a stressful lockdown. The phenomenon saw shoppers spend what they could have during the lockdown and quite possibly reduced the budget and or need for purchasing clothing during the July sales. This factor may have been responsible for the three percent drop in consumption compared to the January sale period.
Our analysis is generated using anonymous transaction data retrieved with the permission of thousands of banking clients in France. If you would like more information about our study, please don't hesitate to reach out to our team.
* Our analysis was conducted based on the anonymous transactional data from consumers shopping at the following DIY stores: Courir, Devred 1902, Zeeman, La Halle !, Etam, Kiabi, Foot Locker, Jennyfer, Zara, Galeries Lafayette, Gemo, Lacoste, Chaussea, H&M, Celio, Vert Baudet, Armand Thiery, Uniqlo, Promod, Printemps Primark, Chausport, OKAÏDI, C&A, Orchestra, Camaïeu, Nike, Naf Naf, Cache Cache. The purchase data used is exclusively from large retailers; therefore, the behavior depicted in this article might not reflect the performance seen in smaller and independent stores.

